Now available: Q4 2022 analysis of Call Report data
It’s that special time of quarter when an analysis of fresh Call Report data is available, including the regular report produced by the Utah Credit Union Association, which focuses on Utah’s credit unions.
In 2022, two Utah credit unions dissolved: Employees First in Logan, and Tri-County, in Panguitch. Puts the number of Utah credit unions at 57.
Utah’s credit unions, on average, continue to out-perform the nation, with higher loan, share, and capital growth, and a higher ROA.
Utah’s credit unions continue to have a lower concentration in 1st mortgages than credit unions nationwide, instead making more “other RE” loans. These are commonly second mortgages or HELOCs.
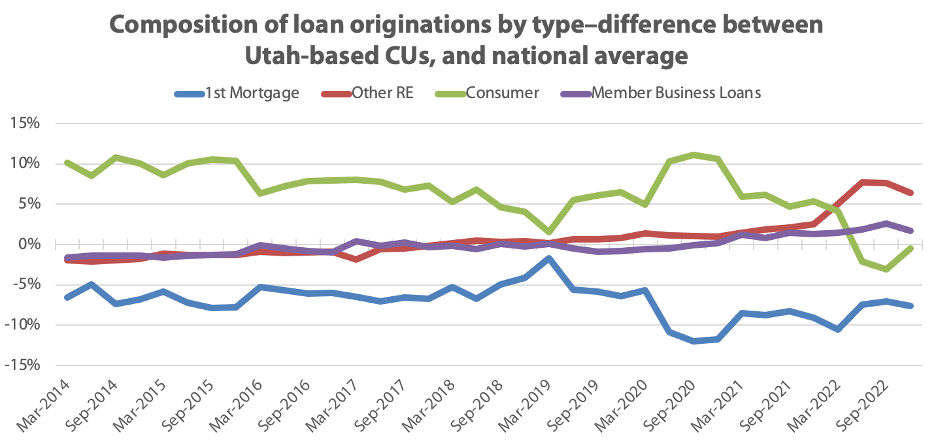
New to the report this quarter are a series of charts that show how the mix of loans for credit unions has changed over time. The first chart, on page 5, shows the difference between loan originations for Utah credit unions and the national average.
Notably, consumer loans and 1st mortgages made by Utah credit unions seem to have an inverse relationship relative to the national average: Utah credit unions don’t make as many 1st mortgage loans, but the amount they are less than the national average, they make up for in consumer loans. This was roughly true up until 2022, when Utah’s credit unions made fewer consumer loans and more “other RE” loans.
There are also three charts on page 6 that track loan originations over time. It’s clear that Utah credit unions started to make more commercial and “other RE” loans in 2022. When compared to the other charts on the page, it’s easy to see the difference between Utah CUs and credit unions nationally: Utah credit unions tend to focus more on consumer loans than 1st mortgage loans, and in 2022 shifted an emphasis to “other RE”.
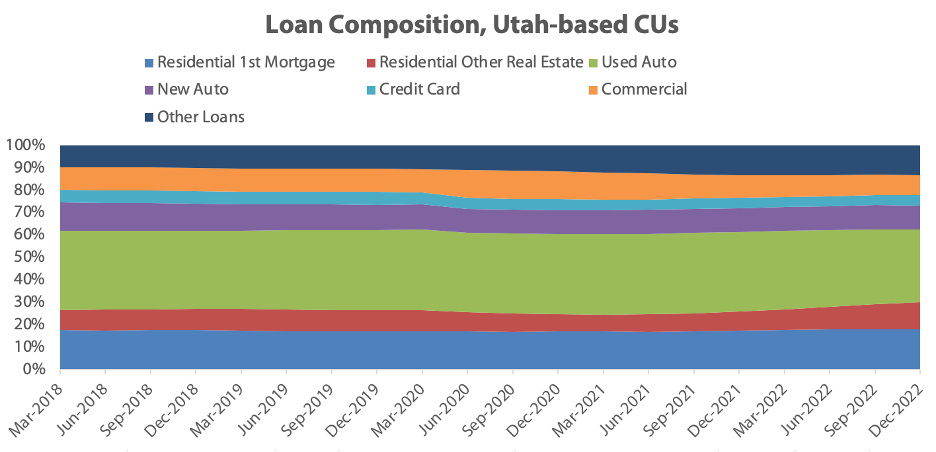
A new chart on page 7 shows the loan composition of Utah credit unions over the last 5 years. It’s clear that changes don’t happen quickly—especially across many credit unions.
During that time, the following categories increased:
Residential other real estate: from 8.88% of loans to 12.15%, with most of that change happening in 2022
Other loans: from 9.74% of loans to 13.12%.
Residential 1st mortgage: from 17.7% to 18.03
The other categories decreased:
Used auto: 35.32% to 32.40%
New auto: 12.69% to 10.5%
Credit card: 5.66% to 4.74%
Commercial: 10.01% to 9.05%
The report includes 27 pages of charts and graphs, looking at a wide array of ratios and comparisons. Download the entire report here.