The figures in the latest quarterly report of Call Report data, focusing on Utah credit unions, show that, generally, Utah credit unions had a good year compared to the rest of the country, although there are signs of increasing consumer stress.
The following numbers are taken from the first page of the report:
US CUs | UT CUs | |
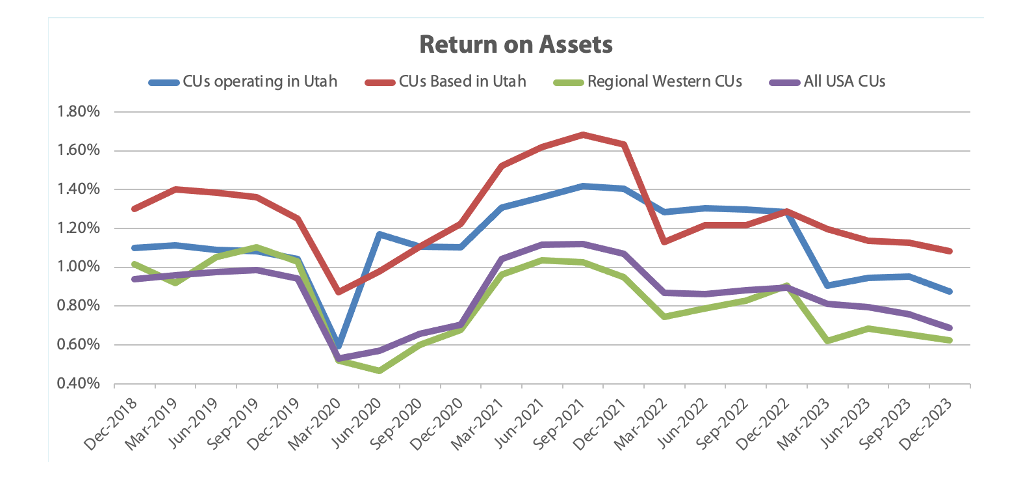
ROA | 0.57% | 0.73% |
12-month loan growth | 8.38% | 4.09% |
12-month share growth | -2.36% | 1.31% |
12-month capital growth | 6.18% | 7.68% |
12-month asset growth | -0.74% | 1.07% |
Loans/Shares | 69.59% | 83.22% |
Net Worth/Assets | 13.57% | 13.97% |
Capital/Assets | 14.04% | 14.55% |
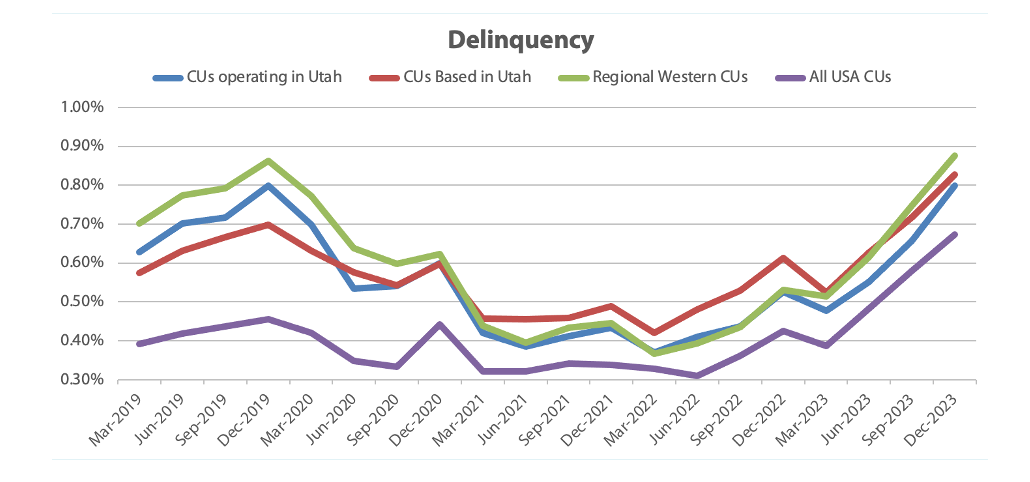
Delinquency Ratio | 1.20% | 0.52% |
Despite the solid performance, there appear to be signs of a rougher economy, generally. ROA, while still healthy, is generally down across credit unions.
Delinquencies have also increased, moving closer to historical norms. The average delinquency rate going back to December 2003 is 0.85% across the industry, basically on par with December’s 0.83%.
Net charge-offs have also increased—once again not rising to extreme levels, but lifting toward historical norms. The long-term average of charge-offs, back to December 2003, is 0.60%, a hair lower than December’s 0.61%.
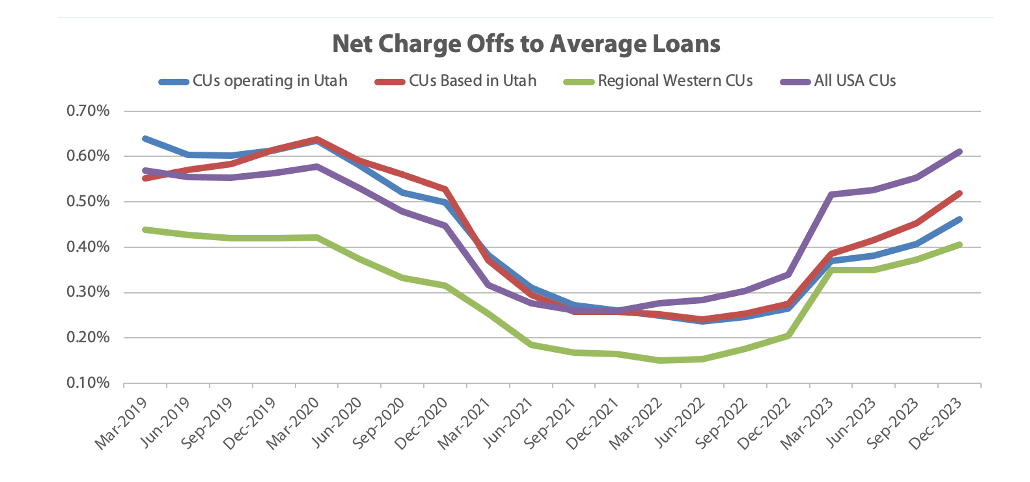
The numbers show just how good credit unions had it in 2001 and 2002. ROA, delinquencies, and net-charge-offs were all better-than average in those years, and started to fade once 2023 came along.
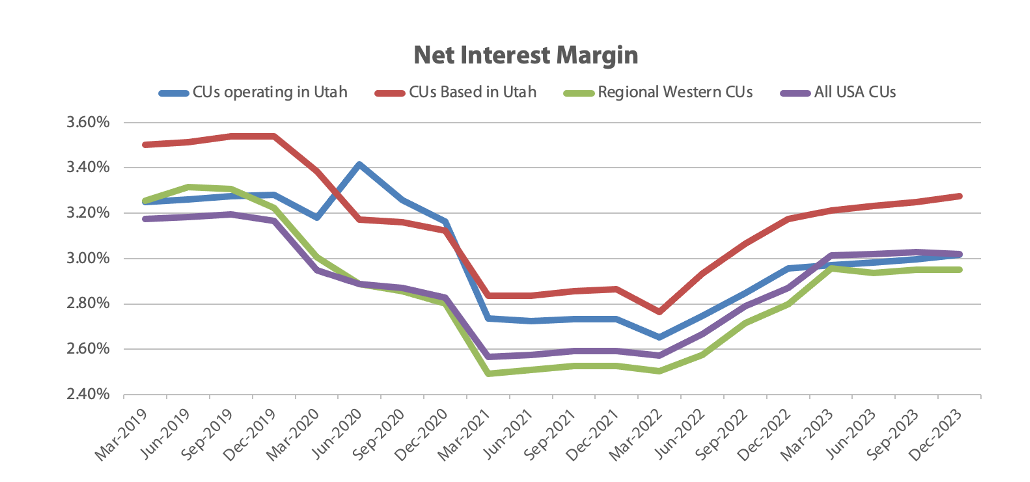
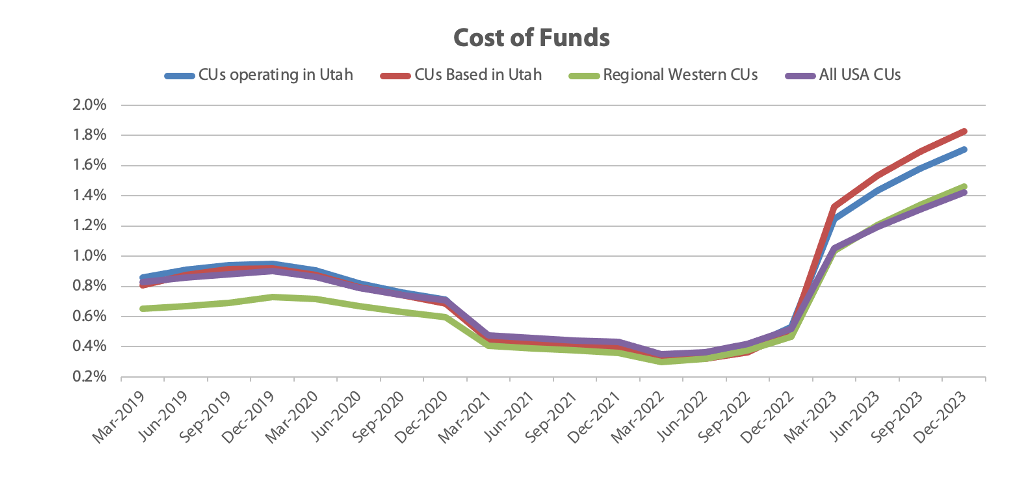
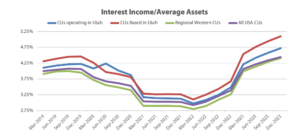
Of course, 2023 was defined by the higher-than-recent-history rates, which increased cost of funds, interest income, and net interest margin—the last of which returned closer to normal levels.
All this information, and more, can be found in the complete report, produced by the Utah Credit Union Association, focusing on Utah’s credit unions, available for download here.